Contents
- 1 Digital marketing competitor analysis: the definition
- 2 Why is competitive analysis a necessity in digital marketing?
- 3 Selecting competitors for digital marketing analysis
- 4 What type of competitive data can we analyze?
- 5 What data can be used for competitive analysis in digital marketing?
- 6 How to use SimilarWeb for competitive analysis?
- 7 How to use SimilarWeb in conjunction with Wayback Machine?
- 8 Exploring other metrics in SimilarWeb
- 9 How to estimate competitor conversion rates with SimilarWeb?
- 10 Other data analysis approaches
- 11 My Digital Marketing Competitor Analysis Services
- 12 Conclusion
Executive Summary
- Digital marketing competitor analysis helps businesses find hidden and low-cost opportunities to outpace competitors.
- Not only can you get insights about SEO, social media, and paid advertising, but also sometimes it’s possible to count conversion rates of your competitors.
- Discover how this analysis based on principles from TIPS (theory of inventive problem solving) can give you a competitive edge for a lower cost.
Digital marketing competitor analysis: the definition
The process of actively analyzing and researching competitors and their strategies within a specific market is called marketing competitor analysis (or competitive analysis). It plays a significant role in multiple crucial processes within a company, such as marketing and sales strategies creation, product development, and even finance.
My view on digital marketing competitor analysis can offer insights to marketers willing to invest time and dig into statistics, while trying to identify contradictions in data. The obtained insights can be used to adjust digital marketing strategies and improve KPIs.
Why is competitive analysis a necessity in digital marketing?
Being able to understand the strategies and capabilities of your competitors is a unique advantage that can offer plenty of ways to boost your own ones. Alternatively, comparing your own capabilities with the rest of the market enables marketers to identify weak strategies and advantageous tactics that are yet to be executed.
With that being said, there are more specific advantages to digital marketing competitor analysis that can be presented, including:
- Setting up realistic objectives for your digital marketing campaigns;
- Creating a more effective mix of traffic channels to fulfill your objective;
- Investing into traffic sources that are performing well for the industry;
- Better budget allocation after learning how competitors manage their resources.
The list above is far from conclusive, even though the general idea is simple – most modern industries are extremely competitive, and methods like these are one of the few that can help companies stand out in the sea of similar products and services.
Selecting competitors for digital marketing analysis
Analyzing every competitor to your business is an unreasonable task. There are dozens of direct competitors to practically any product or service and hundreds of other companies that indirectly compete with the same industry. As such, the first crucial step is choosing the correct competitors to analyze. There are three competitor types I usually review during the selection process. These types are:
- Direct competitors are businesses that work within the same market segment and offer similar products or services;
- Indirect competitors are companies and businesses that target the same market segment but offer products or services that solve the customer’s tasks differently.
However, the most significant point of contention for digital marketing is traffic. Every business that draws traffic away from your website is your competitor — whether through referrals, social media, organic Google search, or PPC campaigns.
That being said, my recommendation for competitor selection is to look for direct and indirect competitors that ultimately compete with you against the same traffic. I recommend avoiding competitors who are not active in the digital field; this saves you time and resources. On the other hand, even if the competitor is indirect, it is still better to consider them if they compete with your company for the same traffic.
What type of competitive data can we analyze?
With the current toolset, in general, we can find out the following about the competitor’s website:
- What traffic sources does the website have
- How exactly are they working (what keywords are used, what creatives are promoted, etc.)
- Their effectiveness in terms of conversion rate and cost-per-action
- What estimated budgets are competitors spending on them
On the contrary, you can identify areas where competitors did not focus, and therefore, understand your growth points. This might involve underinvested marketing channels with low traffic and higher conversion rates. In addition, identifying competitors’ keyword and content gaps can enable you to produce effective campaigns, which could attract traffic and leads.
What data can be used for competitive analysis in digital marketing?
The most reliable method of obtaining web data is a counter on your own website. Still, you obviously can’t install it on your competitor’s website and instantly get all the metrics. Competitive intelligence on the web employs services like SimilarWeb and similar others, which rely on data from various sources to provide insights into website traffic and other digital metrics.
The first source is a partnership with third-party data providers, which compile information from various sources, including transactional data, toolbars, surveys, and other forms of market research. For example, a toolbar is a program installed in the user’s browser. As soon as you install such a program in your browser, some of your actions might possibly be tracked: what sites you visit, how much time you spend there, and what you do on them.
The second source is anonymized traffic data from internet service providers, which can be used to estimate website traffic and engagement levels. ISP servers also retain information on which pages you visited, how much time you spent on them, etc.
The third source could be panel data. Some data providers employ networks of opted-in users who agree to share anonymized and aggregated information about their browsing habits.
The combination of these sources allows platforms like SimilarWeb to offer a comprehensive view of a website’s traffic and digital marketing strategy. It is vital to understand that this data is not 100% accurate. Still, it is correct to use it to identify trends and provide valuable insights for strategic planning. You can assess the trend with statistically significant data, such as whether the traffic on the competitor’s site is increasing or decreasing. Accordingly, you can conclude what analytical decisions to make.
How to use SimilarWeb for competitive analysis?
In this post, I will describe some elements of my analysis framework, not the entire process. As a starting point, here is what you can check in SimilarWeb.
- Overall traffic;
- Desktop vs. mobile traffic share;
- Average time on site;
- Average session depth;
- Bounce rate;
- Geographical distribution;
- Traffic sources and trends.
You can look at up to 5 competitors simultaneously to examine these metrics for all your competitors.
What insights could you get? Examine the overall traffic level and its trend for the last three months (this timeframe is the limitation of the free version). Find out how responsive the competitor’s website is for mobile and tablet devices. Evaluate to what extent the competitor is using mobile traffic acquisition. Align this information with traffic sources, engagement metrics, and bounce rates to decide your acquisition strategy.
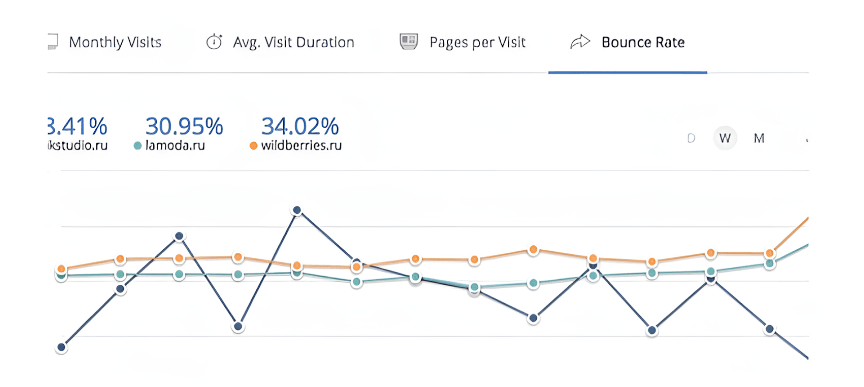
Let me give you some examples. They are relatively old, but can serve as good examples based on the TIPS method of analysis. Here is the data from the old SimilarWeb interface for three Russian websites that we will analyze further:
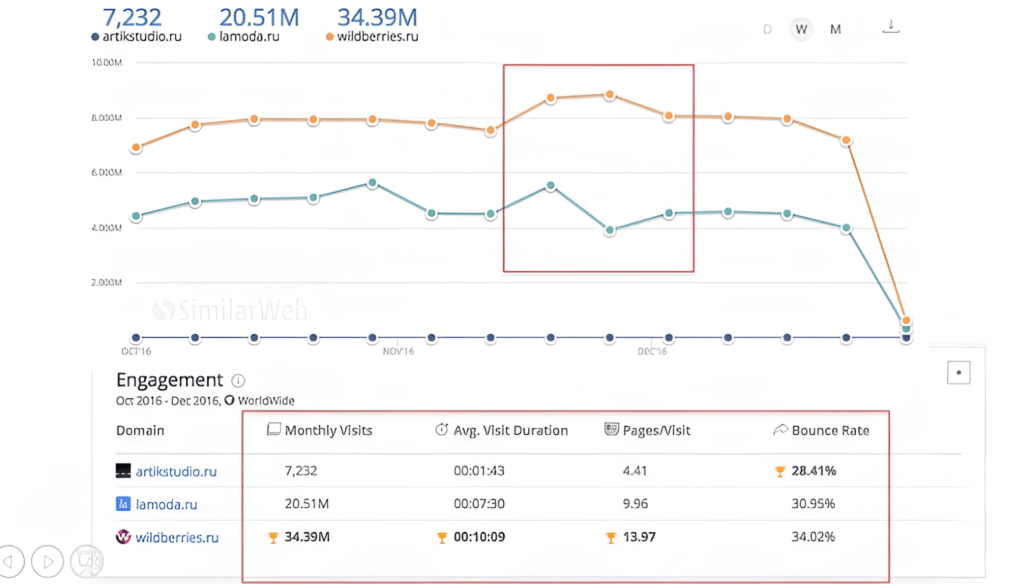

The first was a relatively new start-up online fashion clothes store, Artik Studio. I compared it with Lamoda and Wildberries, two large online clothing retailers. Below the graphs are engagement metrics: the number of monthly visits, average visit duration, session depth, and bounce rate.
I never advise drawing conclusions based on average numbers — that’s the “average temperature of the hospital” (idiomatic Russian language). Instead, I suggest looking for places on the graphs where the data behaves abnormally or contradicts each other. Analyze this specific time frame rather than just looking at the average numbers at the bottom of the screen.
In the above screenshot, I’ve circled it with a red rectangle where the contradiction is observed. Lamoda’s traffic is down, and Wildberries’s is up. To make correct analytical outcomes, readers need to understand that on this national market, Wilbberries and Lamoda at those times were probably accountable for the majority of all the category’s traffic.
When you look at your website’s data in Google Analytics and see a drastic change, you usually realize what happened: a newsletter blast raised traffic, the daily PPC budget was over, and the traffic decreased, or the site went down entirely, and the traffic diminished. When analyzing competitor data, you do not know if a specific action accounts for a particular metric change. Therefore, you need to be able to hypothesize and test.
If we have a situation like the one in the screenshot above, we can assume several things:
- Lamoda could have a downtime due to a technical issue;
- Wildberries could launch an advertising campaign and pull Lamoda’s traffic;
- Lamoda’s website content has changed: a new assortment was added, prices were changed, or the promotion was applied.
How to use SimilarWeb in conjunction with Wayback Machine?
Checking the first two hypotheses should not be a problem; downtime can be seen in a web counter and recently launched advertising campaigns in Semrush or similar tools. What should we do if we are inclined to believe that traffic has been affected by a change in content? For example, an anomaly fell in the last week of November, now February. We can’t go to a competitor’s website and see November’s content because it has already changed. In this case, I recommend turning to the Wayback Machine:
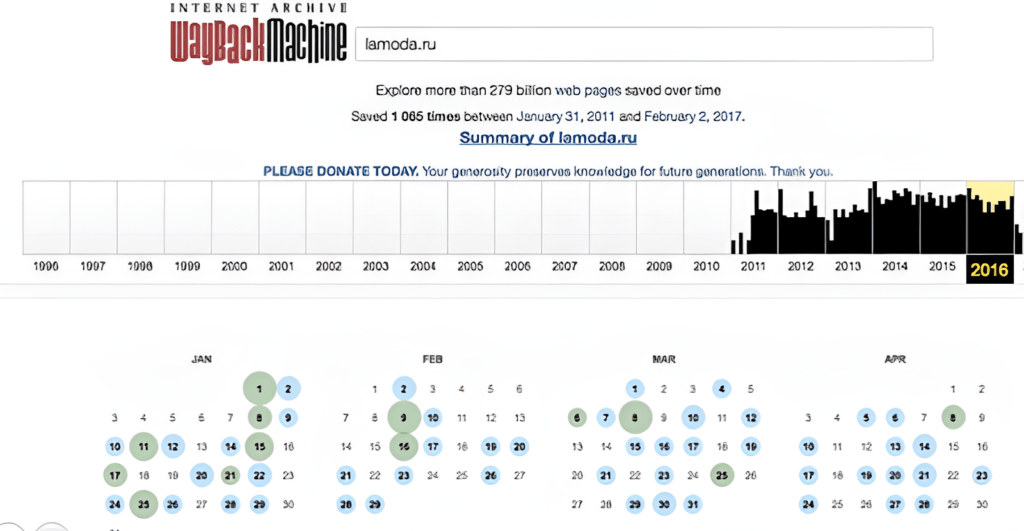

Here we enter Lamoda’s URL and see a timeline showing a snapshot of the website at a particular time. If you click on the blue or green dots, the website will appear in your browser as it was on that date.
Take it as a rule: if traffic diverges in SimilarWeb, go to the Wayback Machine and research what happened with the website content in those days. The Wayback Machine works like a search engine bot by accessing your website and saving a copy to the database for a historical record. Sometimes, this copy isn’t complete, and sites don’t always display correctly. Still, even partial information is valuable for analysis. Users can also submit web pages to be archived, ensuring that essential or endangered content is preserved for future access. The frequency with which pages are captured varies widely, depending on the website and how often the content changes.
Exploring other metrics in SimilarWeb
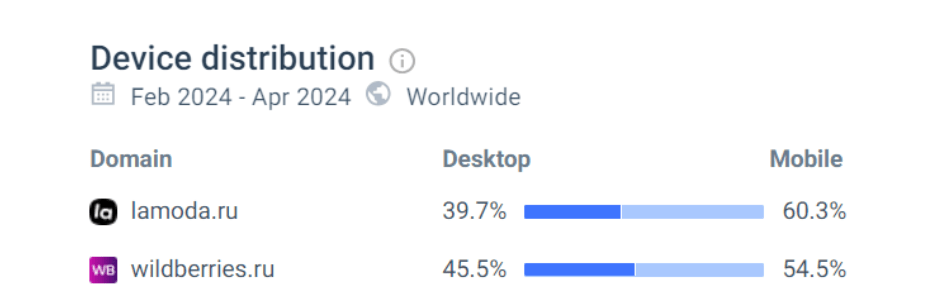
Check out the mobile vs desktop traffic distribution:
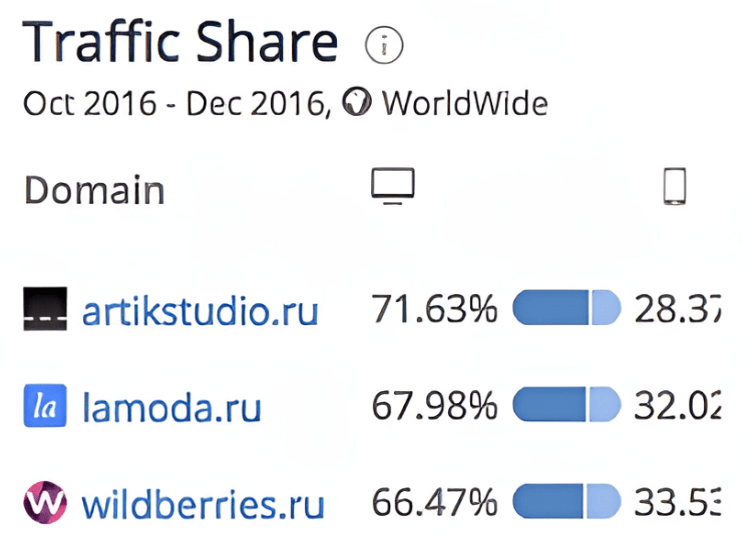

In 2016 only 30% of the traffic was mobile. In 2024 this will increase to about 60% of users coming from mobile devices.

If more people visit your competitor’s website from desktops, there can be two hypotheses. Firstly, the mobile version is likely a weak point, so try investing in mobile functionality optimisation and responsiveness. Secondly, the mobile traffic is not converting, and your competitor focuses on desktops or tablets. The key to understanding is paid traffic; if there is no paid traffic from mobiles, the second hypothesis is likely confirmed. Look at the bounce rates:

The blue and red lines are going up. That’s an increase in bounce rate of about 10-15%. You can make assumptions here. For example, if you see traffic going up along with the bounce rate, your competitors have likely enabled an ad campaign with low-quality traffic.
Look at the distribution of traffic sources by channel:
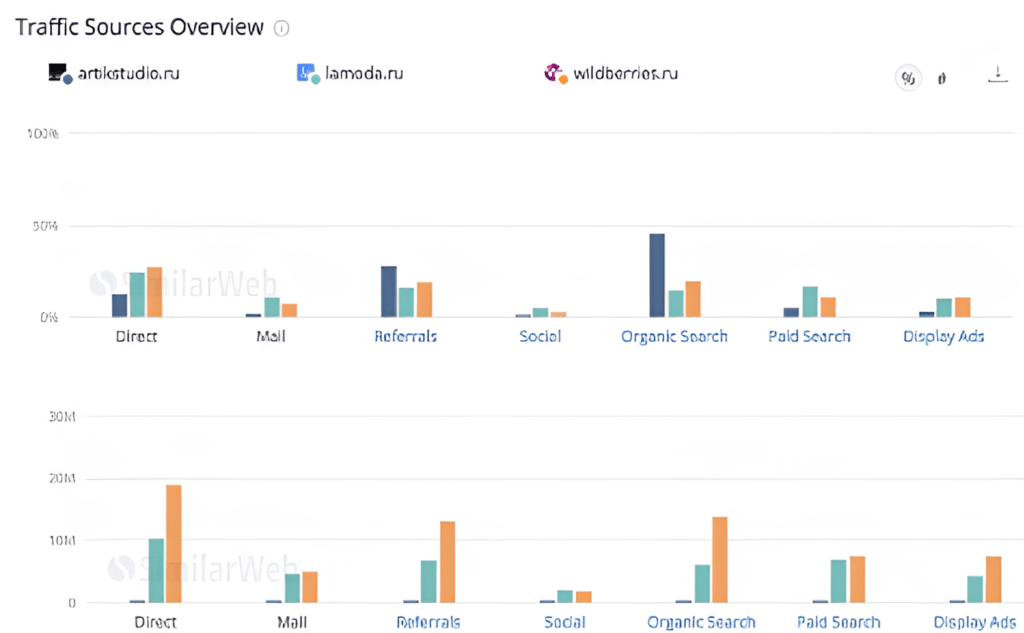

Above are relative values (in percentages), and below are absolute values (in visitors).
Here you can see your competitors’ traffic sources, paid vs. organic distribution, and the amount of traffic they get from each source.
Wildberries have much higher brand awareness, which correlates with the level of direct traffic. Users often go through type-in to this website, which is beneficial as this traffic is free and usually high quality.
You can also click on the names of the traffic sources below the charts and drill down the report for more details. For example, let’s click on search traffic:
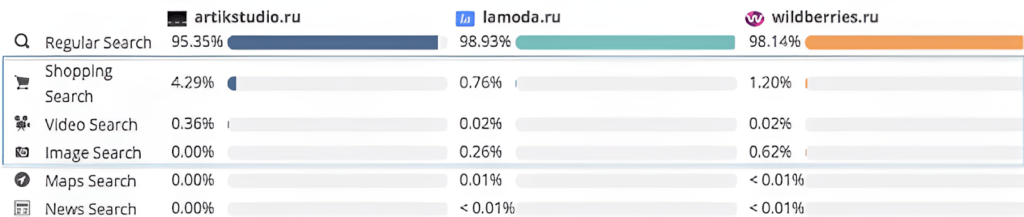

Suppose you’re looking for areas where you can cheaply execute a go-to-market strategy in a crowded market. Take a look at the search distribution. In our case, you can see that the two big stores have little traffic from video search. These are growth points where you can pull traffic to your website inexpensively if you invest in your YouTube channel or in advertising on this video platform. In addition, all websites have a small share of shopping searches, which can effectively generate orders. Specific platforms can vary based on particular use cases; however, the logic behind decisions is always the same: find the less crowded channel with less competition and focus efforts on it.
Outperform Your Competition Online
How to estimate competitor conversion rates with SimilarWeb?
Website content reports help estimate your competitors’ conversion rates. These reports are not available in the free version, but they are sometimes (not always) useful to quantify competitor KPIs. I will demonstrate a method of rough conversion calculation based on demo data from an example clothes store below.
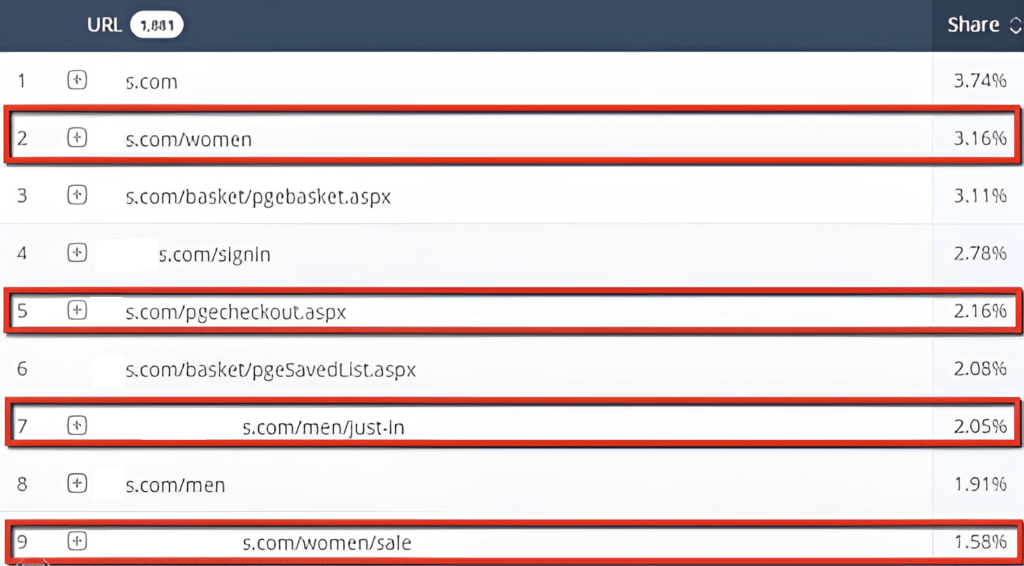

This legacy SimilarWeb report shows us the percentage of traffic for each page on the website.
In the fifth position, we notice pgcheckout.aspx, which refers to the beginning of the checkout funnel. We can see that 2.16% of users go through this page. What does this mean? It’s a conversion marker; 2.16% of all website visitors start the order process.
The shopping cart page is third. Thus, 3.11% go to the cart, and 2.16% proceed to the checkout, meaning the conversion rate is 2.16% or less. If the URL slug of each shopping cart step is different, we can estimate conversion rates for each shopping cart step.
Another helpful feature is the outgoing traffic report. It shows which sites users go to after browsing the analyzed website. I checked Wildberries:
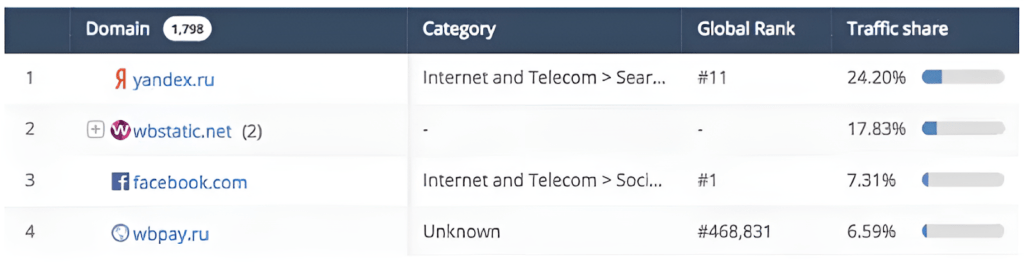

In the fourth place, we see the wbpay.ru website. Browsing it, it becomes clear that Wildberries customers pay for their purchases on this site; it is a payment gate URL. Here is how we can make a conversion rate estimation using this report:
- 6,59% of all outgoing visitors start the order process on the website, according to the screenshot above;
- The overall number of outgoing visitors in this report is 483,000 visitors per month;
- 483,000 multiplied by 0.0659 equals 31,900 visitors that start navigating to the order process;
- 31,900 divided by 3,412,000 overall visitors (not outgoing visits, but all the traffic for the month) equals 0,9%, which is the estimated conversion rate.
This way, you can estimate the conversion rate for the websites whose URL slugs are understandable (always look for words like pay, order, checkout, gate, etc, in slugs).
Other data analysis approaches
Of course, SimilarWeb is not the only marketing solution that can assist with tracking marketing efforts of your competitors. And the proposed framework does not provide deep insights on SEO, pay-per-click and other digital advertising performance. Here are some tools that I use when conducting full competitive analysis for my clients:
- Keyword Planner from Google offers the ability to see the average cost-per-click and volume of keywords in specific regions.
- Ahrefs provides PPC investment data, best-performing landing pages, and current bids on keywords from specific competitors.
- SEMRush can offer an overview of a company’s PPC budgets and advertising strategies, including ad copies, live ads, budget monitoring, and display advertising campaigns.
Tracking organic performance can be slightly more tricky, but there are still multiple tools that can complement SimilarWeb.
- Screaming Frog is a crawler that can detect various potential issues that negatively affect the visibility of a webpage in Google’s search results.
- Ahrefs and SEMRush can assist with finding out the highest-performing keywords and pages in terms of traffic to see how the company in question answers a potential customer’s questions.
- Many SEO solutions, such as Mangools or Ubersuggest, can perform difficulty score analysis and keyword volume assessment. These are essential tools for determining the current ranking of specific competitors and their interactions with trophy keywords.
- Otterly AI is an excellent solution for analysing brand visibility and link citations in LLMs like ChatGPT, Google AI Mode, Gemini and others.
Multiple tools are available for social media competitive analysis.
-
BuzzSumo helps identify trending content and the most shared articles across platforms, as well as understand main influencers in specific industries.
-
Sprout Social and Hootsuite can provide granular analytics on engagement, impressions, and competitor benchmarking.
- Brandwatch or Mention can track brand sentiment and competitor mentions across social media and news outlets.
Even such untransparent acquisition channels like email marketing can be researched:
-
Mailcharts allows you to some extent monitor competitors’ email marketing campaigns.
-
SimilarTech can reveal what marketing automation, CRM, or personalization platforms your competitors are using.
-
BuiltWith is also very handy for identifying the martech stack behind your competitor’s site (from analytics and retargeting pixels to heatmaps and CRM systems).
Outperform Your Competition Online
My Digital Marketing Competitor Analysis Services
1. How does your competitor analysis service work?
I use a structured methodology combining tools like SimilarWeb, SEMrush, Ahrefs, and others demonstrated in this article to gather insights on traffic sources, engagement, keyword strategies, conversion rate and estimated ad spend. All described techniques like data anomaly detection or historical comparisons (e.g., using Wayback Machine) are also used when needed.
2. What insights can you uncover with this service?
- Traffic sources that are underinvested by competitors, and therefore, can be a growth hack
- Keywords, prompts and PPC/SEO/GEO strategies used effectively by competitors
- Conversion rate benchmarks and funnel performance estimates
- Competitors’ marketing mix and budget allocation
Ultimately, you’ll be able to understand gaps in competitors’ strategy and identify underutilized channels or messages that you can capitalize on.
3. Will I get actionable recommendations?
Yes, the outcome of this analysis often includes prioritized insights such as high-opportunity channels, strategic adjustments to budget allocation or targeted KPIs and implementation tactics to boost performance and ROI.
4. How often should competitor analysis be done?
A one-time analysis is valuable in any case, but regular monitoring (quarterly or 2 times a year) ensures you stay ahead of evolving strategies and trends.
5. Is the analysis data accurate?
Tools like SimilarWeb and SEMrush provide estimates using various sources that I discussed above. Though not 100% precise, they are reliable for identifying trends and making informed strategic decisions.
6. How do you adapt the analysis to different industries or markets?
My methodology adjusts based on your industry, geography and other factors. As a general rule, before even starting, I tailor competitor selection and benchmarks to align with your specific niche.
7. What do I receive after the analysis?
You’ll receive a detailed report summarizing findings, a prioritized to-do list and a walkthrough session to align on strategy and execution.
8. How long does a competitor analysis take?
The typical turnaround time is 7–14 days for a standard competitor analysis report. Larger projects may take up to 4 weeks, depending on scope.
9. How much does competitor analysis cost?
My competitor analysis services are billed at AUD 150 per hour (excl. GST). The final cost depends on the number of competitors, channels, and depth of insights required. Below is a breakdown of the main audit components and typical time estimates.
| Audit Component | Estimated Hours | Cost (AUD), excl. GST |
|---|---|---|
| Initial scoping & competitor selection | 1–2 hrs | 150–300 |
| Traffic & engagement analysis (SimilarWeb, Google Analytics, etc.) | 2–3 hrs | 300–450 |
| SEO analysis (technical, content gaps, keyword gaps, backlink review) | 3–4 hrs | 450–600 |
| PPC & ad spend analysis (keywords, ad copy, budget estimates) | 2–3 hrs | 300–450 |
| Social media audit (BuzzSumo, sentiment, engagement) | 1–2 hrs | 150–300 |
| Email marketing performance analysis | 2–3 hrs | 300–450 |
| Report preparation & actionable recommendations | 3–4 hrs | 450–600 |
| Optional walkthrough & Q&A session | 2 hrs | 150 |
-
Basic Report (1–2 competitors): ~15–18 hours → AUD 3,000–3,600 excl. GST
-
Standard Report (3–4 competitors): ~22–26 hours → AUD 4,400–5,200 excl. GST
-
Comprehensive Report (5+ competitors): ~30–35 hours → AUD 6,000–7,000 excl. GST
Conclusion
In my opinion, being able to not only work with your own marketing campaigns but also keep an eye on your competition is a crucial advantage. Competent marketers are capable of creating highly efficient campaigns and strategies based on in-depth information about the competitors’ weaknesses.
There is an entire market of software used for competitor analysis, with examples such as SEMRush, SimilarWeb, Ahrefs and others I listed above. It is important to remember that simply gathering this kind of information is not useful in itself. A marketer would also have to assess their competitors correctly and be able to interpret the information to receive any kind of useful insights.
When this entire process is performed correctly, digital marketing competitor analysis is capable of providing a substantial competitive edge: realistic KPI objectives, better budget allocation, improved traffic channels, and other advantages that result in generally better marketing performance.